Go to Help Summary Go to FAQ Summary
Menu bar/Tools/Progressive Flooding (Advanced)
____________________________________________________________________________________________________________________
Purpose:
When damage compartements set in the 'Intermediate Flooding' layer are present in the ship model without any pipe or opening, the basic '/Tools/Progressive Flooding' function is automatically selected.
Conversely, when ship"s initial damage status causes a progressive inflow of the spaces linked by the existing openings and/or pipes (i.e when they are immersed, linked outboard or connected to a damaged space), this variant of the '/Tools/Progressive Flooding' function is automatically selected, allowing an incremental calculation of the extension of the initial damage in a time range (number of time steps and step duration).
Of course, for obvious reasons, the ‘/Tools/Progressive Flooding’ calculation will be refused if current ship doesn’t contain any intermediate damaged compartment nor active pipe / opening.
In order to process such progressive inflows accurately, the liquid effect of the flooded spaces must be taken into account.
In order to allow such a calculation, openings and/or pipes must simply be present among the current ship components, and cause a progressive flooding of the ship, as explained above:
This incremental flooding proceeds as follows:
- Ship's stability and equilibrium is calculated and registered from the initial to the final stage in the selected time range.
- Depending on the pipes and/or openings immersion, the associated flows are calculated thanks to the Toricelli formula, according to their current discharge coefficient F and their immersed areas.
- According to the specified time increment, these calculated flows allow adding the corresponding inflow from the damaged space(s) to the flooded space(s), assuming that the time increment is small enough for considering the flow as constant. Determining the best time step / time range compromise according to the flooding duration is therefore crucial for getting the best results.
- During the specified time range, this inflow loop will update the free surfaces obtained in the flooded spaces and use them for calculating the next flooding stage (optionally, this flooding scenario can be automatically registered for further use).
Depending on the amount of openings and/or pipes created in the model and on their immersions, this function therefore allows analyzing complex cascading inflows incrementally,
Please, also notice that, as the intermediate damaged compartments are automatically converted into tanks before the stability calculation, their ‘Intermediate Flooding Layer’ must be declared with the same density than the flooding water on [Ship] tab’s [Layers] page (usually ‘Sea Water’).
Inputs:
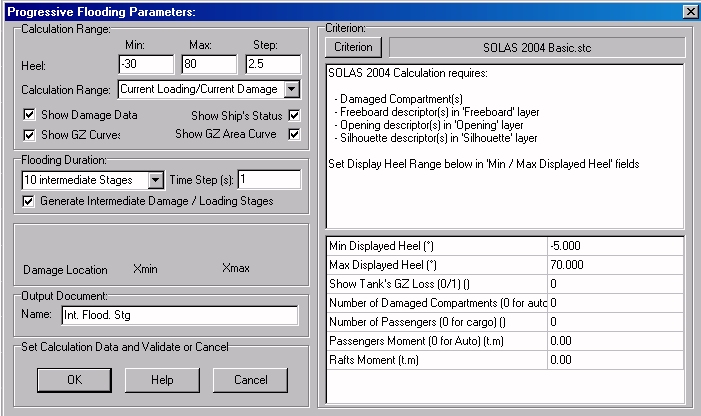
The following dialog box pops up when the function is selected:
The [Criterion] button allows selecting the stability criterion among the available STC scripts (the associated data must be set after this selection). It is recalled that the data listed in the reports correspond to criterion’s ‘Print’ and ‘Test’ statements.
The ‘Heel’ ‘Min’, ‘Max’ and ‘Step’ fields allow defining the stability heel range to calculate. This range must, of course, be thought in order to allow calculating the selected criterion for all the selected damages and loads.
The ‘Side’ selector allows defining on which side the stability has to be calculated.
The ‘Calculation Range’ selector allows selecting for which conditions the Intermediate Flooding Calculations will be repeated:
- ‘Current Loading / Current Damage’: Calculates the Intermediate Flooding reports for the current load and damage only.
- ‘All Loadings / Current Damage’: Calculates the Intermediate Flooding reports obtained by combining all the present ‘Loading Conditions’ with the current damage.
- ‘Current Loading / All Damages’: Calculates the Intermediate Flooding reports obtained by combining all the present ‘Damage Conditions’ with the current loading.
- ‘All Loadings / All Damages’: Calculates the Intermediate Flooding reports obtained by combining all the present ‘Loading Conditions’ with all the present damages.
The ‘Show Damage Data’ check box allows including / removing a damage detailed list in the results (see 3.21.c.3 below).
The ‘Show Ship’s Status’ check box allows including / removing a ship status report in the results (see 3.21.c.4 below).
The ‘Show GZ Curve’ check box allows including / removing the GZ curve in/from the stability diagram (see 3.21.c.1 below).
The ‘Show GZ Area Curve’ check box allows including / removing the GZ Area curve in/from the stability diagram (see 3.21.c.1 below).
The ‘Flooding Duration’ selector allows selecting the number of time steps to calculate in the time range (time range = steps number x time step). Although the calculation time will increase accordingly, the highest steps number wil provide the best results (i.e. the smallest time increments for a given time range).
The ‘Time Step (s)’ input field allows specifying the time increment (in seconds) between the calculated stages. As pipes and opening flows are assumed to remain constant during each inflow iteration, the shortest time steps will be the best. It is therefore useful to have first an approximative idea of the total flooding time in order to divide it by the selected steps number, on the understanding that the greatest steps number will be the best, although calculation time will increase accordingly.
The ‘Generate Intermediate Loading / Damage Stages’ check box allows selecting whether the flooding scenario calculated in the time range will be conserved or not among the ship data. When checked, a folder is created, containing the loading conditions / damage conditions found for each intermediate stage.
The ‘Swell Data’ frame only activates when a WoD criterion is selected, allowing to specify swell’s height Hs and current damage’s ‘Xmin’ and ‘Xmax’ limits (when the calculations must be repeated for all the current damages, attention must be paid to the fact that the damage limits must preliminarily be set individually in their ‘Xmin’ /’Xmax’ fields on the [Data] page).
The ‘Output Document Name’ input field allows naming the 2D folder in which the resulting reports will be created in the 2D browser.
The [OK] button can be clicked for calculating ship’s data and creating the corresponding report. Nevertheless, as this calculation may be time consuming, a confirmation box recalls the number of stability calculations before starting.
The [Help] button allows displaying the online help (Internet access necessary).
The [Cancel] button allows cancelling the calculation.
Pressing the [Escape] key when calculation is started allows aborting it.
Outputs:
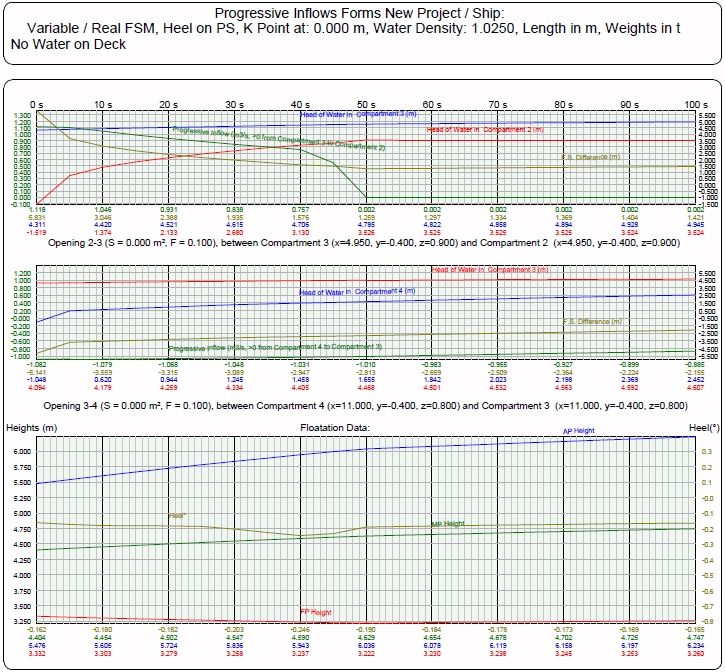
The Progressive Flooding Outputs are the followings:
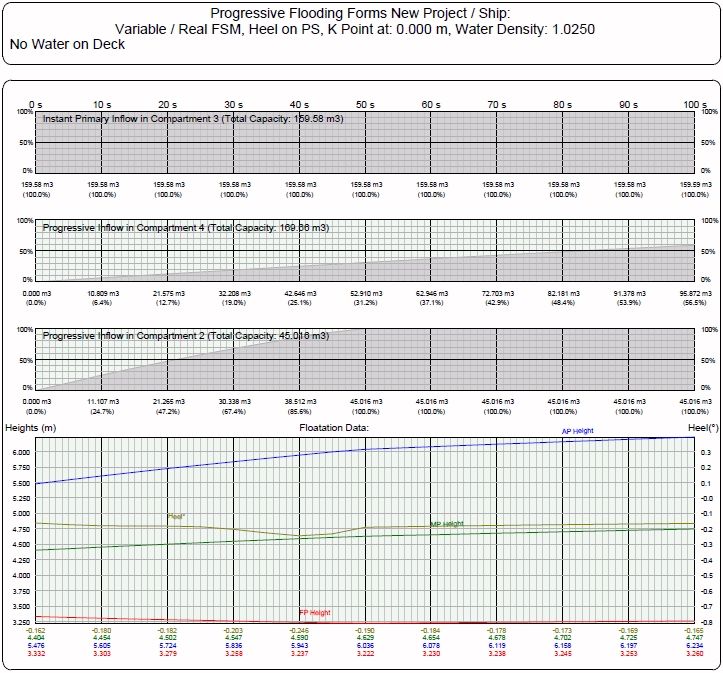
Inflow Diagrams according to Time:
Depending on Criterion’s compliance according to time, diagram's background color is green (compliant) or red (non compliant):
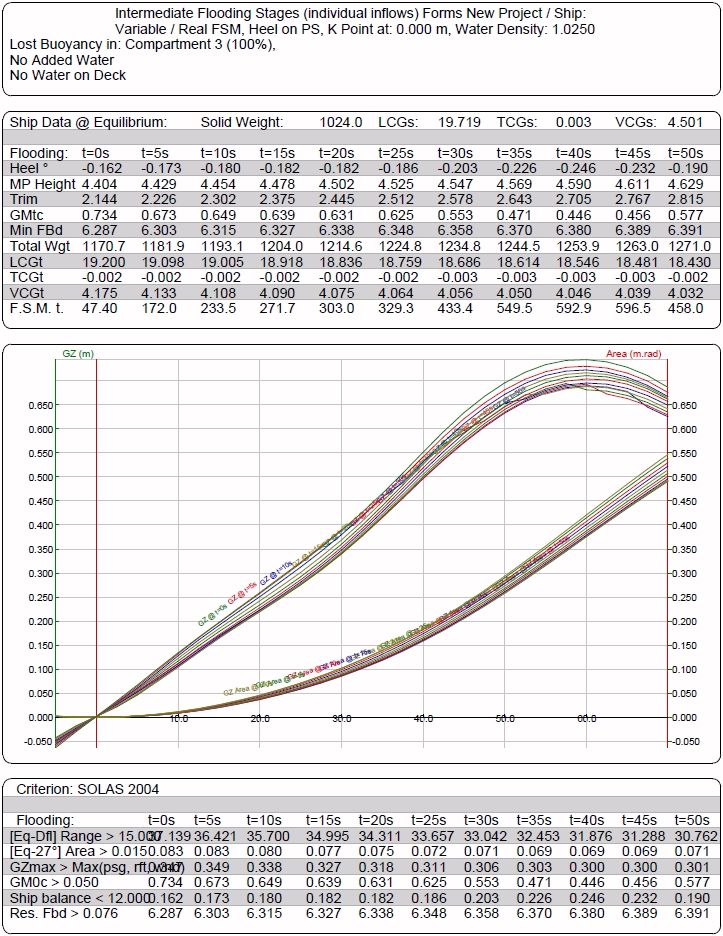
Intermediate Flooding Stability Curves:
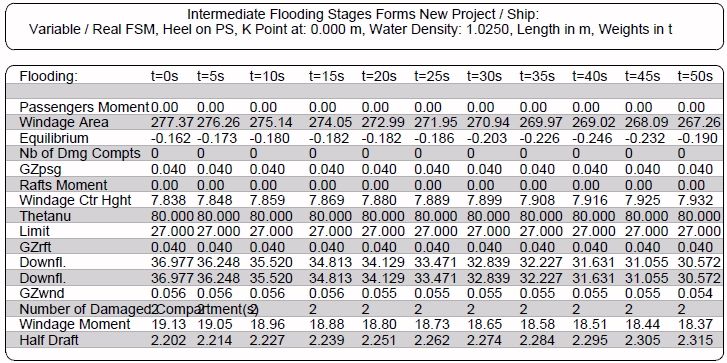
Stability Curves and Criterion’s Tested results are listed by groups of 10, depending on the time range and step:
Ship Status:
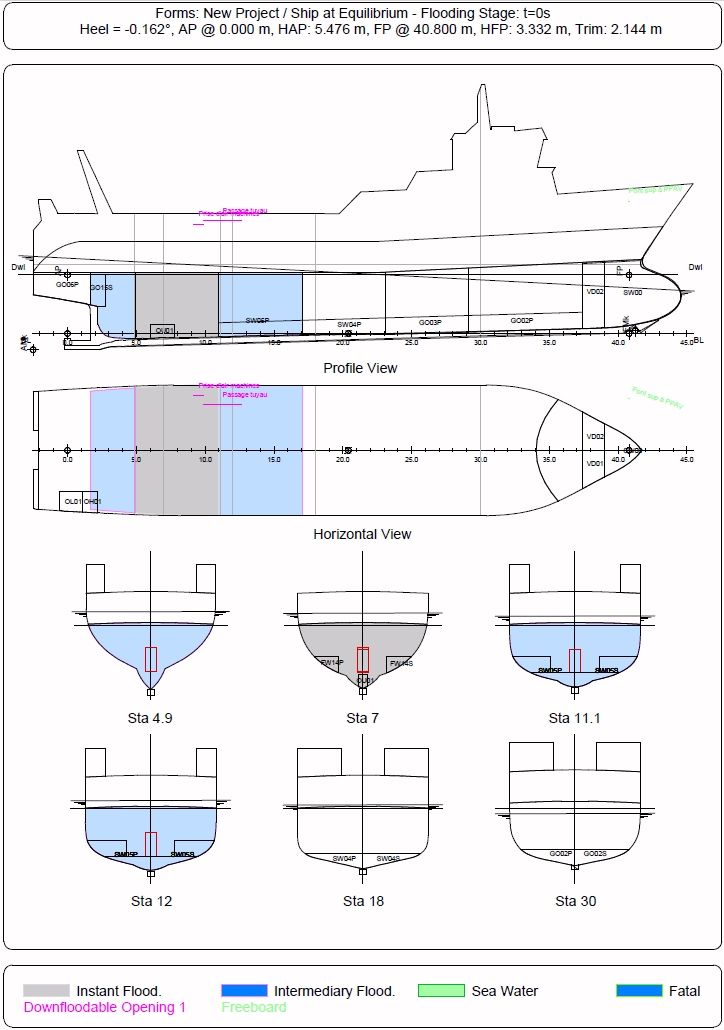
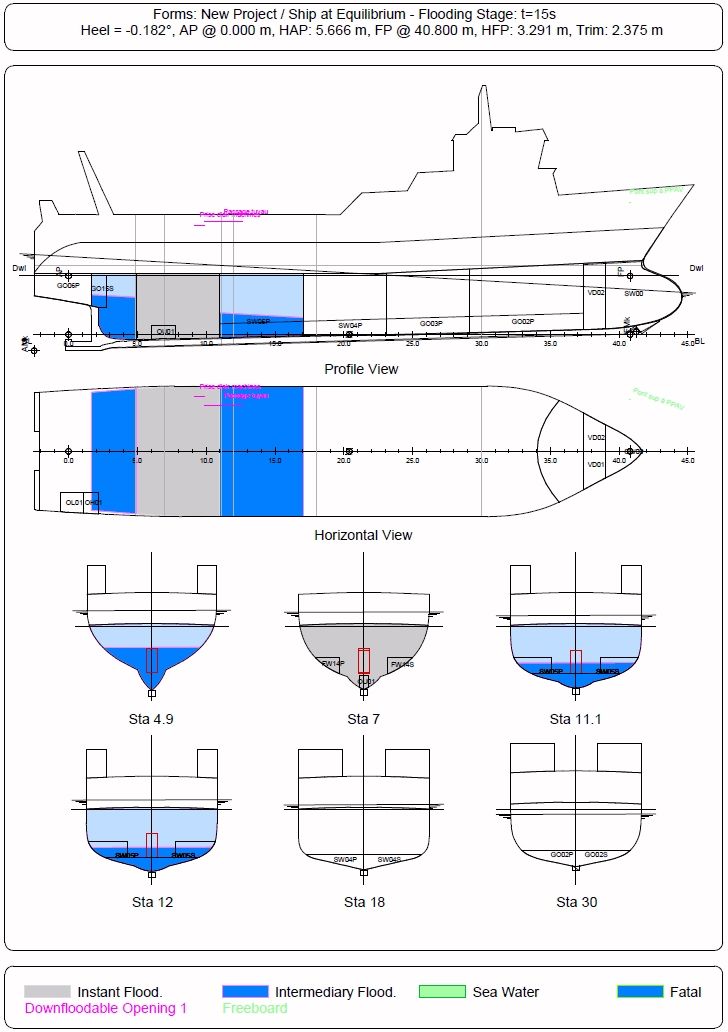
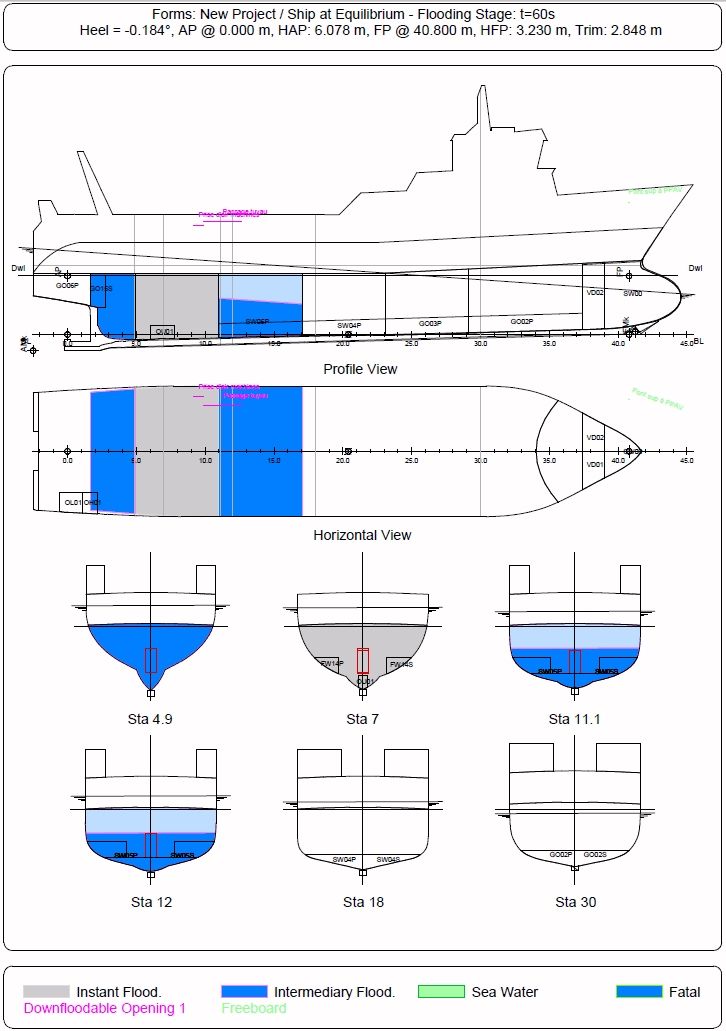
As soon as the Compartment / Damage Layout is defined, all the calculated stages can be presented individually:
...
...
Limitations:
- The number of calculated stages must remain between 1x10 and 10x10.
- The damage and loading condition(s) must be realistic.
- The Time Range and increment must be adapted..
Typical use:
Analyzing the progressive extension of a primary damage and its incidence on ship's stability acording to time.
Example:
- Open the ‘Example Ship Damaged.m2a’ file.
- Select '/Curve/Rectangle/Corner to Corner' in the menu bar.
- Type '17,-0.4,0.6' [Return] to enter first rectangle's corner.
- Type '17,0.4,2.5' [Return] to enter second rectangle's corner.
- Select the created rectangle (named 'rectangle corner + corner') in the 3D browser.
- Right Click and select 'Convert Line to Opening' in the popup menu.
- Select compartment 'C3' as first compartment and compartment 'C4' as second compartment in order to link them by this opening.
- Set the opened and closed discharge coefficients: Fopened=0.9 / Fclosed=0
- Set opening's name to 'Opening' and click on the [OK] button to validate these data: Notice that the initial line icon has been replaced by a green 'Opening' icon in the 3D browser.
- Select '/Tools/Progressive Flooding' in the menu bar and notice that the calculation is refused, as no progressive inflow can occur as long as none of the linked compartments is flooded (but it would have been accepted if the opening was opened 'outboard' or at least 1 compartment was damaged and set in the 'Intermediary Flooding' layer ) .
- Select the opening again in the 3D browser, right.click and select Set Opening Data' in the popup menu in order to chack / modify its data if necessary.
- Select compartment 'C3' in the 3D browser, right click and select 'Damage Selected Item(s)' in the popup menu, in order to make the inflow of C4 through 'Opening' possible.
- Select '/Tools/Progressive Flooding' again and notice that the dialog box now appears, as progressive inflow is now possible, as long as the opening is immersed .
- Enter 1 (second) in the 'Time Step' input field and select the 'SOLAS 2004' criterion before clicking [OK] to start the incremental flooding.
- Control the obtained reports.
- Return to the [Data] page and set the opening to the 'Closed' status in the 'Quantity' columw.
- Select '/Tools/Progressive Flooding' again and notice that the calculation is now refused.
- Select the opening in the 3D browser, right.click and select 'Convert Opening to Line' in the popup menu in order to revert back to the initial line.


